1. 线程的查看
首先创建两个线程:
#include <stdio.h>
#include <unistd.h>
#include <pthread.h>
#include <stdlib.h>
#include <string.h>

void* pthread_run1(void* arg)
{
    (void)arg;

    while(1)
    {
        printf("I am thread1,ID: %d\n",pthread_self());
        sleep(1);
    }
}

void* pthread_run2(void* arg)
{
    (void)arg;

    while(1)
    {
        printf("I am thread2,ID: %d\n",pthread_self());
        sleep(1);
    }
}


int main()
{

    pthread_t tid1;
    pthread_t tid2;

    pthread_create(&tid1,NULL,pthread_run1,NULL);
    pthread_create(&tid2,NULL,pthread_run2,NULL);

    printf("I am main thread\n");

    pthread_join(tid1,NULL);
    pthread_join(tid2,NULL);
    return 0;
}分析:上面程序中创建了两个线程,程序执行起来,main 函数所在程序为主线程,在这个主线程中有两个新线程运行
命令行查看:
//查看当前运行的进程
ps aux|grep a.out
//查看当前运行的轻量级进程
ps -aL|grep a.out
//查看主线程和新线程的关系
pstree -p 主线程id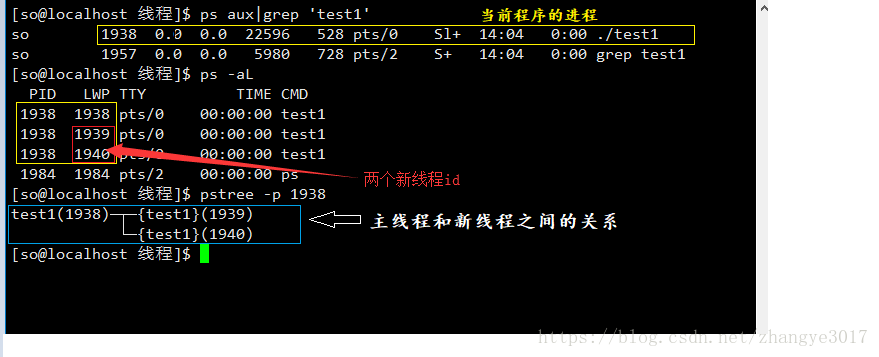
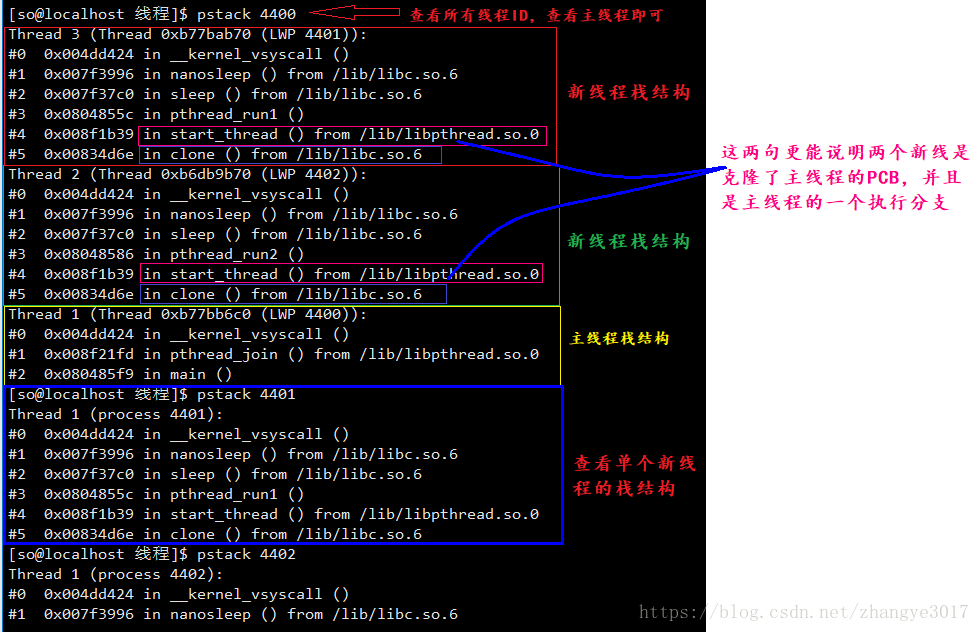
2. 线程栈结构的查看
- 获取线程ID
- 通过命令查看栈结构
ps stack 线程ID
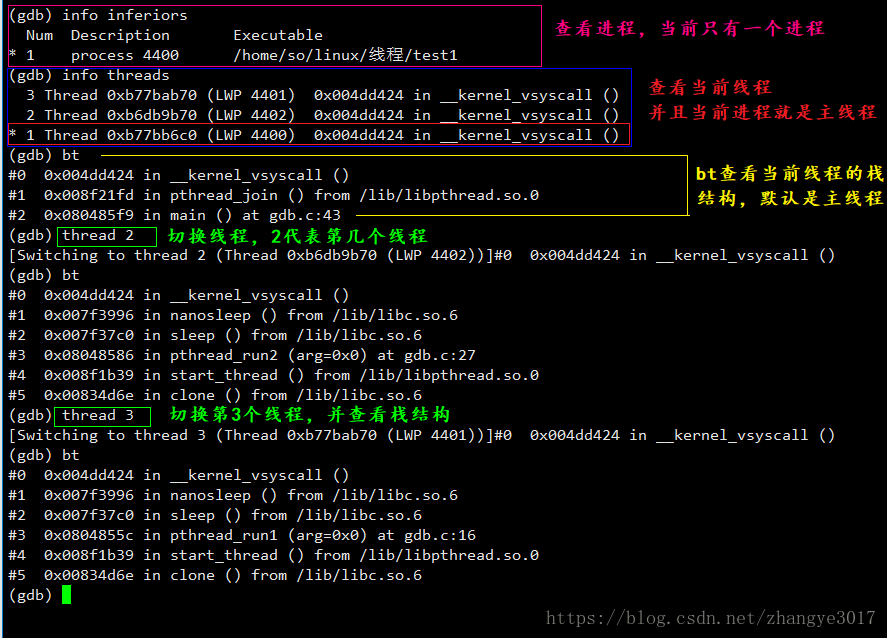
3. 利用gdb查看线程信息
//1.查看进程:info inferiors
//2.查看线程:info threads
//3.查看线程栈结构:bt
//4.切换线程:thread n(n代表第几个线程)
4. 利用gdb调试多线程
当程序没有启动,线程还没有执行,此时利用gdb调试多线程和调试普通程序一样,通过设置断点,运行,查看信息等等,在这里不在演示,最后会加上调试线程的命令
总结调试多线程的命令:
| 命令 | 用法 |
|---|---|
info threads |
显示当前可调试的所有线程,每个线程会有一个GDB为其分配的ID,后面操作线程的时候会用到这个ID。 前面有*的是当前调试的线程 |
thread ID(1,2,3…) |
切换当前调试的线程为指定ID的线程 |
break thread_test.c:123 thread all(例:在相应函数的位置设置断点 break pthread_run1) |
在所有线程中相应的行上设置断点 |
thread apply ID1 ID2 command |
让一个或者多个线程执行GDB命令command |
thread apply all command |
让所有被调试线程执行GDB命令command |
set scheduler-locking 选项 command |
设置线程是以什么方式来执行命令 |
set scheduler-locking off |
不锁定任何线程,也就是所有线程都执行,这是默认值 |
set scheduler-locking on |
只有当前被调试程序会执行 |
set scheduler-locking on step |
在单步的时候,除了next过一个函数的情况(熟悉情况的人可能知道,这其实是一个设置断点然后continue的行为)以外,只有当前线程会执行 |